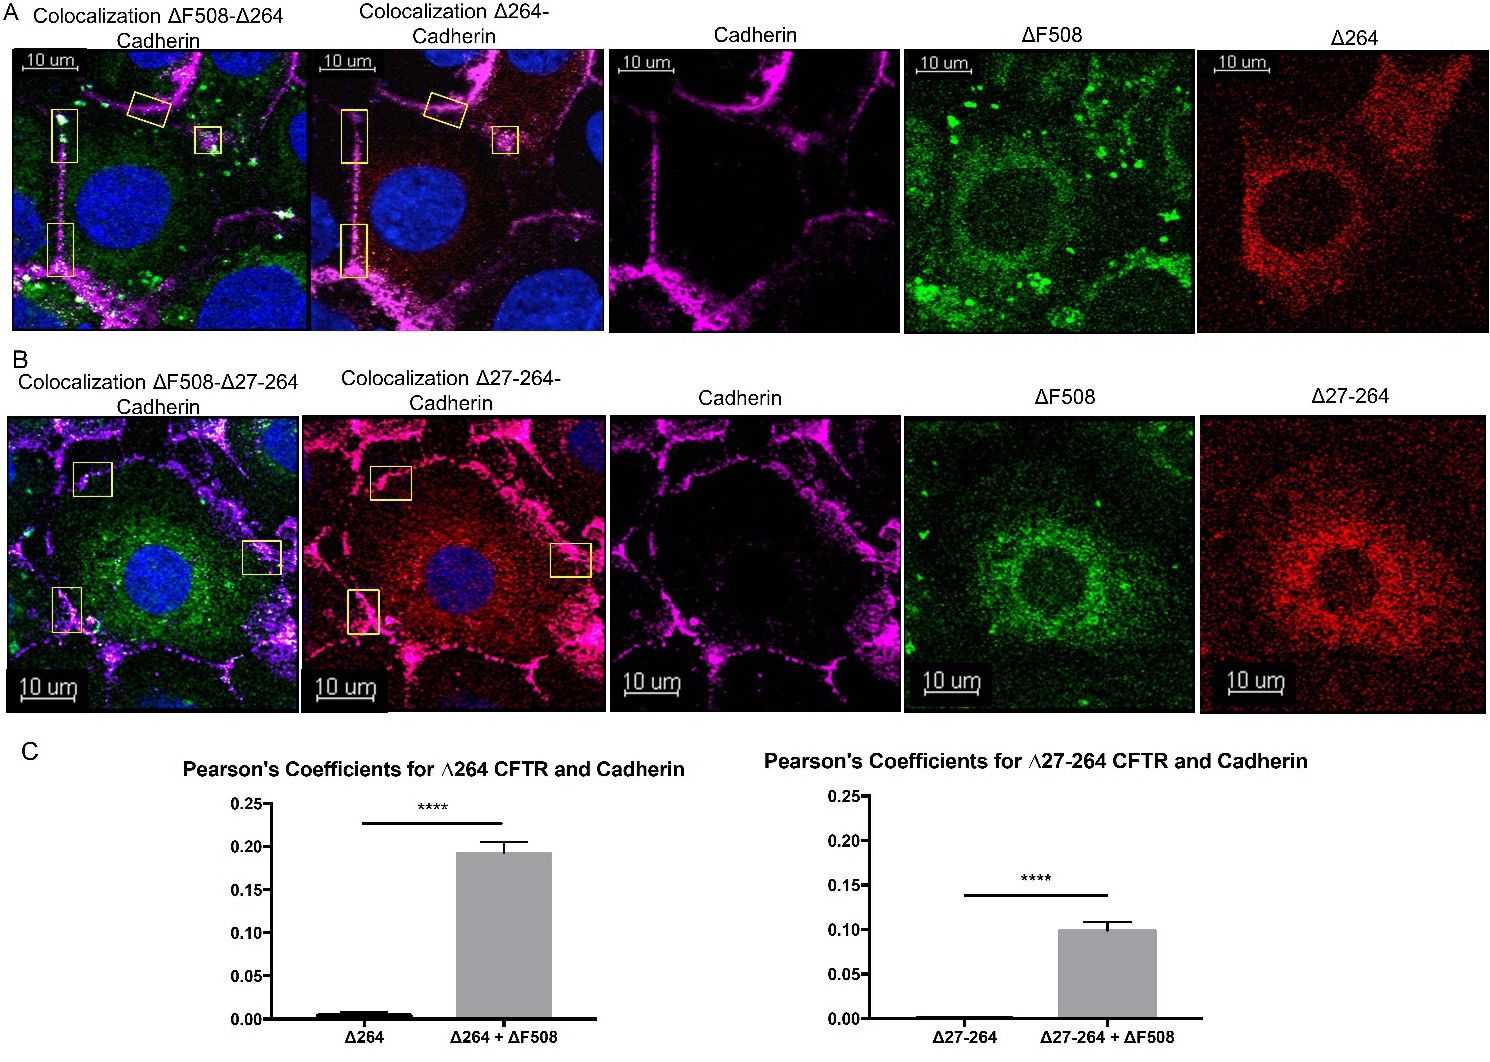
Fig. 5. (A) Δ264 CFTR and F508-del become localized to the plasma membrane. (A) CFBE41o- parental cells were plated on coverslips and co-transfected with Δ264 CFTR-mCherry (red, Δ264 CFTR) and F508-del CFTR-GFP (green, F508-del). At 48 h post-transfection, the cells were fixed, permeabilized, and stained with DAPI (blue, nucleus) and antibodies against cadherin (purple, plasma membrane). The yellow boxes indicate areas where there is close association or co-localization between Δ264 CFTR and cadherin. Co-transfection of F508-del CFTR-GFP and Δ264 CFTR-mCherry occurred in 21.1% of the cells (27/128); of the cells stained for cadherin (purple), 100% (10/10) showed co-localization or close association between Δ264 CFTR and F508-del. (B) Δ27-264 CFTR and F508-del become localized to the plasma membrane. (A) CFBE41o- parental cells were plated on coverslips and co-transfected with Δ27-264 CFTR-mCherry (red, Δ27-264 CFTR) and F508-del CFTR-GFP (green, F508-del). Co-transfection of F508-DEL CFTR-GFP and Δ27-264 CFTR-mCherry occurred in 23.5% of the cells (35/150); of the cells stained for cadherin (purple), 100% (9/9) showed co-localization or close association between Δ27-264 CFTR and F508-del. Representative extended-focus images are shown, and data were selected from one of four independent experiments. (C) The graphs show Pearson's correlation coefficients of Δ264 CFTR and Δ27-264 CFTR and cadherin when F508-del CFTR is co-transfected into cells, as compared to control samples (no F508-del CFTR). The coefficients were calculated using Imaris Imaging Software. Pearson's correlation coefficients were increased with F508-del CFTR co-transfection. Results are means ±SE. (n = 4) ****p<0.0001.